
Anionic PAM injection rate optimization is a pressure response problem before it is a dosage calculation. In our production support work, the most common error is holding one target rate too long and correcting after the pattern has changed. The practical method is to build a rate window from reservoir pressure and produced water response, then adjust by well pattern and fluid signal. The sections below cover the first rate window, the field sequencing schedule, drift signals, and what to confirm before startup.
What Do You Need Before Setting an Anionic PAM Injection Rate?
Before a rate is set, the reservoir has to answer four questions. Permeability controls how far the polymer solution travels before pressure builds. Oil viscosity sets the mobility ratio and therefore the acceptable dosage range. Water cut shows how much remaining oil justifies polymer cost. Well spacing sets the total fluid volume and the injection pressure ceiling. If any of these four data points is missing, the first field test should be a small rate hold, not a full block commitment.
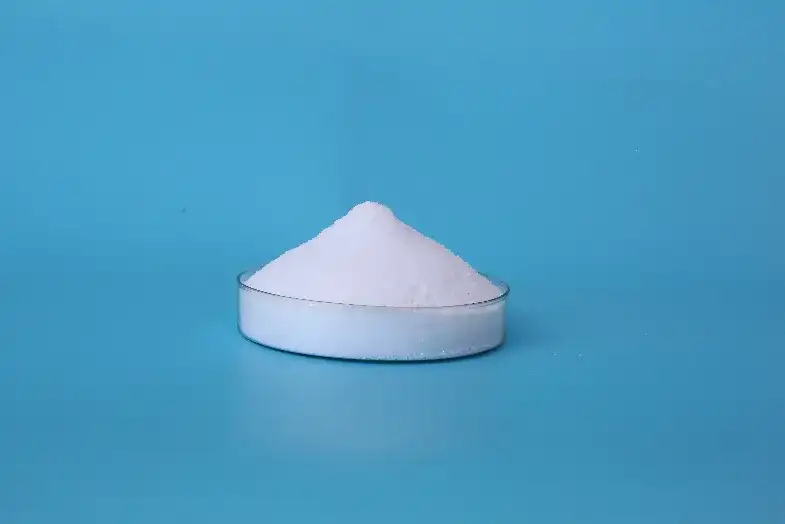
For anionic PAM with molecular weight above 30 million, the rate window is narrower than operators sometimes expect. Bridging increases viscosity quickly, so a high concentration at high flow can push injection pressure toward the parting point before a produced oil response appears. We treat the first rate as a diagnostic step, not the final setting.
Which Parameter Sets the Injection Ceiling?
Permeability contrast matters more than average permeability. A large water-cut difference between layers routes polymer into the most open path, so injection pressure may stay low while sweep efficiency stays poor. The highest safe rate is therefore governed by the low-permeability layer, not the average rock. We log this layer before we select the first rate band.
How Do You Build an Initial Anionic PAM Injection Rate Window?
Build the window from active polymer demand, not from powder feed rate alone. If a block receives 2,000 m³/d and the target injection concentration is 600 ppm, the active polymer requirement is 1,200 kilograms per day. The dry powder feed is that figure divided by the product active content. When we confirm active content by certificate, we convert the laboratory target into a daily feed rate that the pump operator can hold.
| Rate component | Field input | Effect on the window |
|---|---|---|
| Target concentration | Produced water viscosity and oil mobility | Sets active polymer mass per day |
| Active content | Supplier certificate | Converts active mass to dry powder feed |
| Block injection volume | Total daily water volume | Scales dosage to reservoir volume |
| Permeability contrast | Core or pressure data | Caps the upper rate before pressure spikes |
| Pressure ceiling | Fracture gradient or step-rate test | Hard stop for any increase |
Why Does Active Content Change the Rate Window?
Active content is the difference between loading the truck and loading the reservoir. Two products with the same label can carry different active concentrations. Without this figure, the operator cannot convert between polymer demand and dry powder feed, and rate changes become trial and error. We ask for the certificate before the first pump test because the window depends on mass, not label volume.
How Do You Sequence Rate Changes Across Well Patterns Without Pressure Spikes?
Sequencing matters more than the final number. We start with the lower band and hold it long enough for a bottomhole pressure response. The first hold confirms that the polymer is entering the target layer and not leaking into a high-permeability channel. After that, each increase stays small, usually 10% to 15%, with a hold period between steps.
- Record baseline injection rate, wellhead pressure, and produced water salinity before polymer.
- Start at the lower band and hold for a full pressure stabilisation period.
- Step up only after the pressure curve flattens, not by a calendar schedule.
- Compare produced water polymer concentration and water cut before expanding.
- Apply successful settings to adjacent wells, then recheck the whole pattern.
What Happens When a Rate Increase Is Made Too Early?
An early increase mixes the old pressure signal with the new one. The operator then raises the rate again from a false baseline. In a low-permeability layer, this cycle can reach the parting pressure without a clear warning because each reading is taken before the reservoir has stabilised. We prefer to miss a short production window rather than lose the pressure signal that the whole program depends on.
If your block has high permeability contrast or a variable water cut, it is worth confirming the anionic PAM grade and rate window before finalizing the injection schedule. Send the reservoir data and target concentration to en*****@***er.com and ask for a rate confirmation against the product specification.
What Field Signals Show the Injection Rate Needs Correction?
One signal is a pressure curve that rises without flattening. If the hold period passes and pressure continues upward, the rate is likely above the formation’s acceptance capacity. A second signal is produced water chemistry that does not change. When a polymer slug is working, produced water viscosity should move in the same direction as injection concentration. No response means the slug may be bypassing the target pore space.
The clearest failure mode is parting. Once injection pressure crosses the fracture gradient, the pressure signal flattens because the fluid is opening a channel rather than sweeping the matrix. From that point, additional polymer volume no longer improves recovery; it only fills the channel. We watch for this transition before adjusting any other variable. If the rate was raised twice without a produced water response, we stop the increase and hold pressure data until the trend declares itself.
How Do You Confirm an Anionic PAM Injection Program Before Startup?
Rate calculations look reliable on a spreadsheet but shift once the reservoir takes over. If the injection water chemistry, permeability, or target concentration falls outside the range used in the first test, the original window no longer applies. Confirm the product active content, molecular weight grade, and residual monomer specification with the supplier before pump start. Send your block data and target rate range to Shandong Nuoer Biological Technology at en*****@***er.com or call +86-532-66712876, and we will check the recommended anionic PAM grade against the field parameters.
What Are the Most Common Questions About Anionic PAM Injection Rates?
What concentration should a first anionic PAM flood start with?
Start at the lower end of the calculated window rather than the target design rate. The first test exists to read pressure response, not to prove the design number. A low start gives the reservoir time to accept the polymer without parting, and the operator can raise the rate after the pressure curve flattens. Starting at the upper band risks losing the diagnostic signal before the test produces useful data.
Does higher molecular weight always improve injection performance?
Not always. High molecular weight anionic PAM above 30 million builds viscosity quickly, which raises sweep efficiency in the right formation. In a low-permeability or high-contrast block it can also raise injection pressure toward the parting point earlier than a lower or mid-range grade. The correct choice follows the permeability and pressure data, not the highest specification number.
How long should a rate hold last before an increase?
It depends on pressure response, not a fixed number of days. In a low-permeability layer we hold until the pressure curve flattens, which may take two to four weeks. In a block with high permeability and a fast response the hold can be shorter. If pressure is still rising at the end of a planned hold, the hold should be extended rather than the rate increased.
What field data should be logged during an injection test?
In our field support, logging pressure, water cut, and produced water viscosity together has caught rate drift earlier than pressure alone. The three signals do not move at the same time, so recording only one misses early bypass. Daily logs with a consistent reference point also make later rate decisions easier to defend. Share your target concentration, water salinity, and injection rate range at en*****@***er.com, and we will confirm which anionic PAM grade matches the program.
If you’re interested, check out these related articles:
Acrylic Acid Suppliers: Quality Testing & Procurement Strategies
Non-Ionic Polyacrylamide Factory: Textile Industry Solutions
Acrylamide Crystal Dissolution: Optimizing Polymerization Efficiency


 English
 Russian
 Arabic
 Spanish